SHAP Values and Feature Variance
Intepretability is a Good Idea
My machine learning graduate program was technically excellent, but I had to learn how to (semi-)convincingly communicate with interdisciplinary collaborators the hard way: by failing a lot on the job. Before explainable/interpretable machine learning become a more popular research direction in 2016/2017, the end-product of my ML analyses often looked like this:
In other words, I thought demonstrating the success & importance of a ML-based analysis was the same as demonstrating methodological validity in an academic publication. This is wrong. My collaborators rarely cared about the results, and forgot them quickly. These days, I still show a table like the one above but I also show a SHAP values plot:
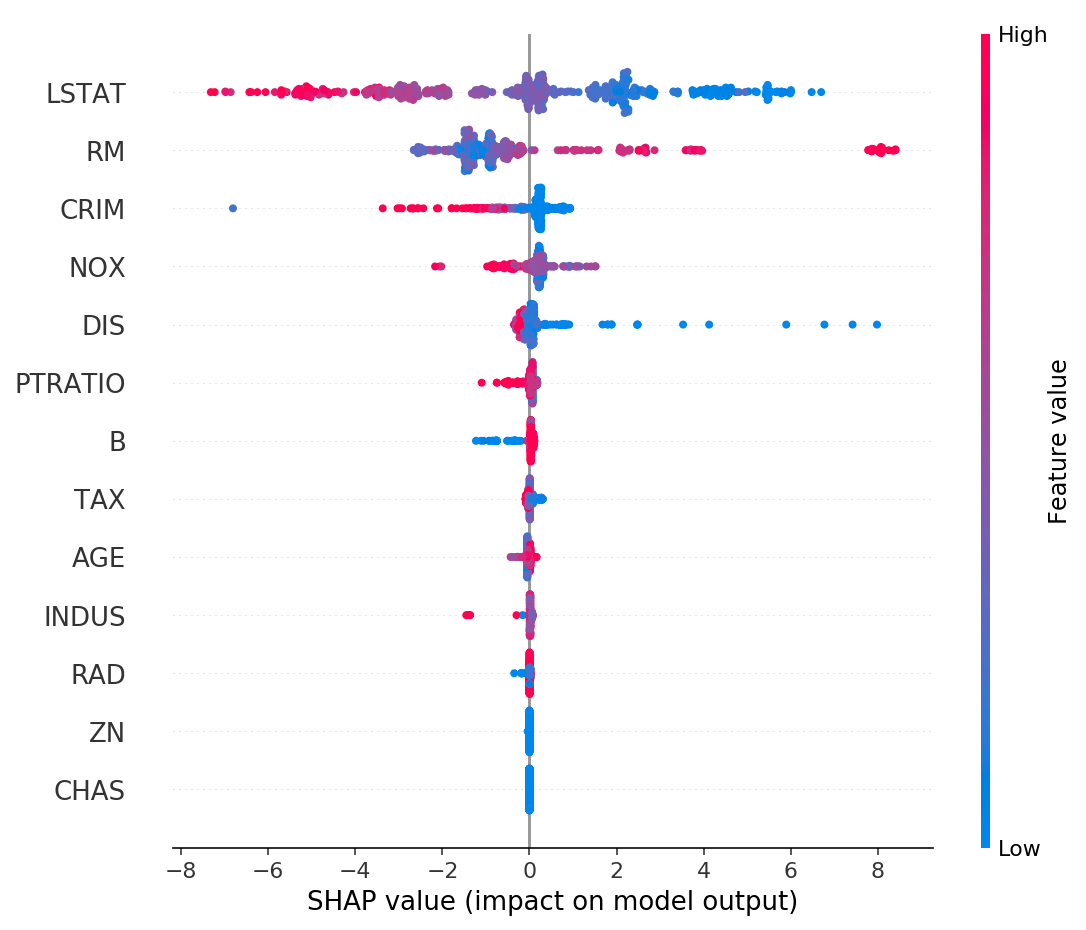
This image is taken directly from the SHAP Github repository. There are plenty of papers and other sources explaining SHAP values in detail, so I won't do that here. Briefly, each row is a feature/covariate input to a machine learning model, and each dot is a data point (sample). The x-axis is the SHAP value: how important a feature is for a particular sample in the model. Color is the original value of the feature. It takes some staring at this plot to fully internalize everything it's telling you, but showing it alongside standard ML results has been a great way to engage collaborators in other disciplines.
By the way, SHAP values are not the only way to interpret ML models, but they just happen to be one I like, and the SHAP library is simply excellent.
Reasons for Small SHAP Values
When looking at the SHAP value plots, what might be some reasons that certain variables/features are less important than others? If you had asked me this question a month ago, here is the list I would have given you:
- The variable is measured in a noisy way.
- The variable is not that causally related to the outcome of interest.
- The variable is highly correlated with another variable that happens to be more predictive of the outcome.
Some of these are not that different from one another. For example, if a variable is noisy, then it will certainly look less related to the outcome of interest. The point isn't to have a theoretically iron-clad list of reasons, but to give the collaborators some idea of how ML models work.
Recently I chatted with a friend who does economics for a living, and he suggested another important reason that wasn't on my list: the variable has low variance. This wasn't immediately obvious to me, so I ran some simulations to gain intuition. My friend was right, and so I thought it would be a good idea to share the finding in case others have the same blind spot that I did.
Experimental Setup
Here's some Python code to generate the data:
import numpy as np

def generate_data(n_samples=1000, p=0.5):
    # Generate 4D input
    X = np.random.randn(n_samples, 3)
    x4 = np.random.binomial(1, p, n_samples)
    X = np.column_stack([X, x4])

    # Generate output y as a function of X
    y = X[:, 0] + 2*X[:, 1] + 0.5*X[:, 2] + 3*X[:, 3] + np.random.randn(n_samples)*0.1

    return X, y
The input is 4-dimensional, and we're only changing the variance of the 4th Bernoulli dimension. Bernoulli random variables are always 0 or 1, so all we are doing is changing the proportion of 1s and 0s. Tweaking the \(p\) input doesn't at all change the ground-truth mapping between input \(x\) and output \(y\). Intuitively, I would have expected that SHAP values variable importance is not affected when changing \(p\). Let's see what happens in practice with a simulation study:
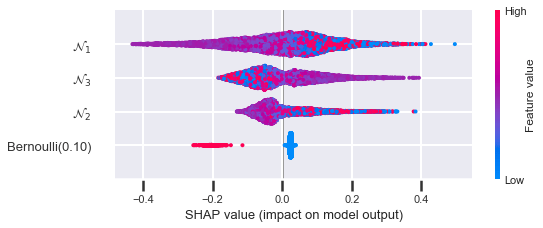
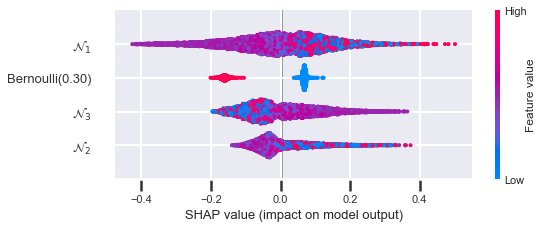
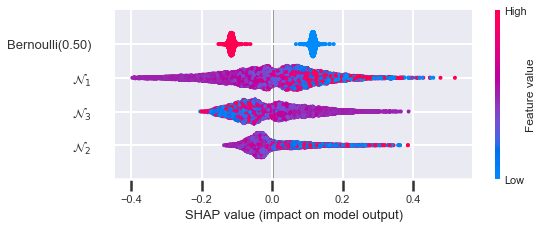
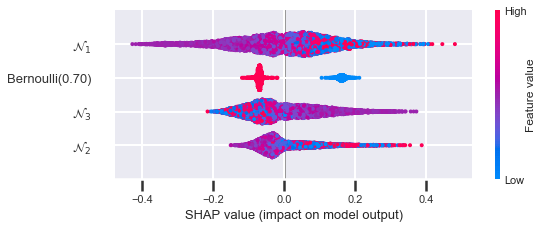

You can see that when the variance is smallest (\(p = 0.1\) and \(p = 0.9\)), the Bernoulli feature is at its lowest ranking. When the variance is largest (\(p = 0.5\)), the feature is at its highest ranking. Here is the how the sum of the absolute SHAP values looks when you plot it against \(p\):
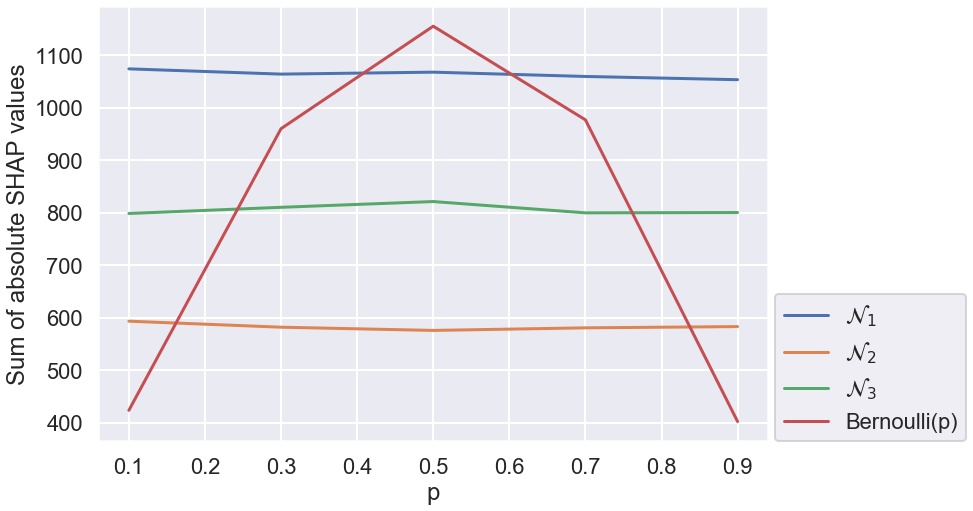
Exactly as described above: the overall importance is proportional to the variance. So we've learned that SHAP values are affected by the variance of the input feature.
Here all four variables are stable regardless of \(p\). Range of SHAP values is also good to consider when thinking about a variable's overall interestingness. That is, a variable might not be predictive overall because it has low variance in our dataset, but it might very predictive for a small subset of the sample population.
Some Intuition
To gain some intuition about why this happens, let's think about a variable that is actually very causal for outcome \(y\) but happens to be completely constant in our dataset. If \(y\) is being able to survive and the Bernoulli feature \(x_4\) is access to drinking water, then clearly \(x_4\) is directly causal of \(y\), but most human health datasets have \(x_4 = 1\), and so the learned ML model would make no use of this variable; the SHAP values would all be zero. But imagine a dataset of 100k people where exactly one person has \(x_4 = 1\) and the rest have \(x_4 = 0\). Overall, there is little relationship in the data between \(x_4\) and the outcome, and a ML model might not even notice this extremely rare sample as being predictive. The variance went from 0 to a little bit, and the SHAP values maybe went up a bit. The higher the variance rises, the more likely the model is to rely on this variable for making its decisions, and the larger the SHAP values will be in total.